|
DALLAS, May 15, 2020 (GLOBE NEWSWIRE) -- Today, GWG Holdings, Inc. (Nasdaq: GWGH), a financial services holding company committed to transforming the alternative asset industry through innovative liquidity products and related services for the owners of illiquid alternative investments, announced its financial and operating results for the first quarter ended March 31, 2020. The results reflect consolidated accounting and financial reporting of GWGH and The Beneficient Company Group, L.P. (Ben LP) and related entities (collectively, Ben).
Recent Corporate Developments
- Despite the uncertainty surrounding the novel coronavirus pandemic (COVID-19), the Company continues to raise capital, pay and receive interest income and dividends, receive insurance policy benefits, and otherwise meet its ongoing operating obligations.
- On March 30, 2020, the Company filed a registration statement to offer up to $2.0 billion in principal amount of L Bonds on a continuous basis until 2023. These bonds contain terms and features that are substantially consistent with previous L Bond offerings.
- On May 15, 2020, Ben and its lender signed a term sheet to amend its senior credit and subordinated credit agreements. Among other changes, the amendment would extend the maturity date of both loans to April 10, 2021, and provides for them to be transferred to GWGH or a subsidiary upon issuance of Ben’s trust company charters by the Texas Department of Banking. The amendments set forth in the term sheet are subject to, among other things, the negotiation and execution of definitive agreements governing the amendments and the satisfaction of closing conditions.
- On March 6, 2020, Ben submitted revised trust charter applications to the Texas Department of Banking which the Department is actively reviewing and considering. In the interim, Ben has closed a limited number of transactions to date, but intends to significantly expand its operations if and when the trust charters are issued.
First Quarter 2020 Financial and Operating Highlights
- Reported first quarter 2020 net loss of $49.4 million, compared to a net loss of $18.9 million in the first quarter of 2019
• GWGH’s investment in Ben was accounted for as an equity method investment prior to the change-of-control on December 31, 2019, and the first quarter of 2020 includes the consolidated results of Ben for the first time.
• Recognized $68.9 million of non-cash, equity-based compensation expense during the first quarter of 2020 as a result of grants under Ben’s equity incentive plans, which significantly contributed to the consolidated net loss. The recognition of these Ben expenses is a result of the transactions between Ben and GWGH that created the year-end 2019 gain. The majority of those awards vest over a four-year period beginning on the grantee’s service date to Ben (e.g., hire date for an employee). Because many participants in Ben’s equity incentive plans have been with the company for multiple years, some awards vested up to 100 percent on the grant date and that vesting required recognition of the commensurate equity-based compensation in the first quarter 2020 filing. The grant date value of the awards was based on the recent valuation of Ben completed in conjunction with the change-of-control event on December 31, 2019. Equity-based compensation expense on a quarterly basis going forward is expected to be significantly lower based on the awards outstanding as of March 31, 2020.
- Reported total assets of $3.7 billion as of March 31, 2020, compared to $3.6 billion as of December 31, 2019.
- Reported continued strong life insurance portfolio performance:
• Realized $25.5 million of face amount of policy benefits from 20 life insurance policies during the first quarter of 2020, compared to $30.5 million from 20 life insurance policies during the first quarter of 2019.
• Ended the quarter with a life insurance portfolio of $2.0 billion in face amount of policy benefits consisting of 1,131 policies.
- Reported continued success raising capital through the L Bond investment product with $110.8 million of L Bond sales in the first quarter of 2020.
- Continued its shift in focus away from new life insurance policy acquisitions and towards its investment in Ben, while managing its existing life insurance policy portfolio. As part of that strategic shift, the Company has ended its Life Care Exchange program for purchasing policies.
Reported total liquidity (cash, restricted cash, policy benefits receivable and fees receivable) increased to $188.7 million at March 31, 2020.
“In this unprecedented time, we are working hard to support our advisors and the clients they serve,” said Murray Holland, GWGH’s Chief Executive Officer. “We believe our products are uniquely positioned to provide a combination of yield and stability as advisors and broker-dealers report a need for liquidity at a previously unseen level among our target market of individual and small institutional investors.”
1. Financial & Operating Highlights
| ($ Thousands except per share information) |
Q1 2020
|
|
|
Q1 2019
|
|
| Revenue |
$ |
33,557 |
|
|
$ |
25,217 |
|
| Expenses |
|
124,050 |
|
|
|
37,904 |
|
| Income Tax Benefit |
|
14,507 |
|
|
|
— |
|
| Loss from Equity Method Investments |
|
(1,530 |
) |
|
|
(1,927 |
) |
| Net Loss, including Loss from Equity Method Investment |
|
(77,516 |
) |
|
|
(14,614 |
) |
| Loss Attributable to Noncontrolling Interests |
|
32,084 |
|
|
|
— |
|
| Preferred Stock Dividends |
|
3,952 |
|
|
|
4,296 |
|
| Net Loss Attributable to Common Shareholders |
|
(49,384 |
) |
|
|
(18,910 |
|
| Per Share Data: |
|
|
|
|
|
|
|
| Net Loss1 |
|
(1.62 |
) |
|
|
(0.57 |
) |
| Capital Raised from L Bonds |
|
110,825 |
|
|
|
125,985 |
|
| Liquidity2 |
|
188,661 |
|
|
|
183,896 |
|
| Life Insurance Portfolio3 |
|
2,000,680 |
|
|
|
2,098,428 |
|
| Life Insurance Acquired3 |
|
— |
|
|
|
80,211 |
|
| Face Value of Matured Policies |
|
25,502 |
|
|
|
30,459 |
|
| TTM Benefits / Premiums4 |
|
184.3 |
% |
|
|
154.8 |
% |
| |
|
|
|
|
|
|
|
(1) Per diluted common share outstanding
(2) Includes cash, restricted cash, policy benefits receivable and fees receivable as of the end of the period presented
(3) Face amount of policy benefits
(4) The ratio of policy benefits realized to premiums paid on a trailing twelve month (TTM) basis
2. Revenue and Expense Discussion
First Quarter 2020 vs. First Quarter 2019:
• Total revenue was $33.6 million in the current period, compared to $25.2 million in the prior period primarily due to:
- The Ben consolidation added $9.4 million of interest income from its financing receivables portfolio, after intercompany eliminations, and $5.0 million in trust services and other fee revenue.
- Interest income of $1.1 million on the LiquidTrusts promissory note.
- These increases were partially offset by $7.0 million of lower gains on life insurance policies primarily due to slightly lower average face value of matured policies and no gains on acquisitions.
• Total expenses were $124.1 million in the current period, compared to $37.9 million in the prior period primarily due to:
- Employee compensation and benefits increased by $72.6 million for this period primarily due to the inclusion of Ben’s operations, which included the recognition of $68.9 million of non-cash, equity-based compensation expense under Ben’s equity incentive plans.
- Interest and fees increased by $8.9 million due to $6.1 million of additional interest expense on L Bonds as a result of increased amounts outstanding, increased interest expense of $2.3 million from the consolidation of Ben related to its borrowings, and increased interest expense of $0.5 million on GWGH’s senior credit facility.
- Legal and professional fees increased by $3.2 million primarily due to additional legal and consulting fees recognized with the full consolidation of Ben’s operations beginning in the first quarter of 2020.
3. Life Insurance Portfolio Statistics as of and for the quarter ended March 31, 2020
Portfolio Summary:
| Total life insurance portfolio face value of policy benefits (in thousands) |
$ |
2,000,680 |
|
| Average face value per policy (in thousands) |
$ |
1,769 |
|
| Average face value per insured life (in thousands) |
$ |
1,900 |
|
| Weighted average age of insured (years) |
|
82.6 |
|
| Weighted average life expectancy estimate (years) |
|
7.2 |
|
| Total number of policies |
|
1,131 |
|
| Number of unique lives |
|
1,053 |
|
| Demographics |
|
74% Males; 26% Females |
|
| Number of smokers |
|
47 |
|
| Largest policy as % of total portfolio face value |
|
0.7 |
% |
| |
|
|
|
| Average policy as % of total portfolio |
|
0.1 |
% |
| Average annual premium as % of face value |
|
3.5 |
% |
| |
|
|
|
Distribution of Policies and Benefits by Current Age of Insured:
| |
|
|
|
|
|
|
|
|
|
Percentage of Total |
|
|
|
|
| Min Age |
|
Max Age |
|
Number of
Policies |
|
|
Policy
Benefits |
|
|
Number of
Policies |
|
|
Policy
Benefits |
|
|
Wtd. Avg.
LE (yrs.) |
|
| 95 |
|
101 |
|
|
20 |
|
|
$ |
42,602 |
|
|
|
1.7 |
% |
|
|
2.1 |
% |
|
|
2.1 |
|
| 90 |
|
94 |
|
|
147 |
|
|
|
289,269 |
|
|
|
13.0 |
% |
|
|
14.5 |
% |
|
|
3.2 |
|
| 85 |
|
89 |
|
|
232 |
|
|
|
544,264 |
|
|
|
20.5 |
% |
|
|
27.2 |
% |
|
|
5.0 |
|
| 80 |
|
84 |
|
|
247 |
|
|
|
439,948 |
|
|
|
21.9 |
% |
|
|
22.0 |
% |
|
|
7.2 |
|
| 75 |
|
79 |
|
|
223 |
|
|
|
369,024 |
|
|
|
19.7 |
% |
|
|
18.4 |
% |
|
|
9.9 |
|
| 70 |
|
74 |
|
|
199 |
|
|
|
247,346 |
|
|
|
17.6 |
% |
|
|
12.4 |
% |
|
|
11.1 |
|
| 60 |
|
69 |
|
|
63 |
|
|
|
68,227 |
|
|
|
5.6 |
% |
|
|
3.4 |
% |
|
|
11.3 |
|
| Total |
|
|
|
|
1,131 |
|
|
$ |
2,000,680 |
|
|
|
100.0 |
% |
|
|
100.0 |
% |
|
|
7.2 |
|
| |
|
|
|
|
|
|
|
|
|
|
|
|
|
|
|
|
|
|
|
|
|
|
4. Ben’s Collateral Portfolio Information
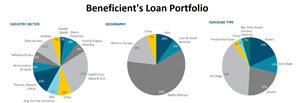
As of March 31, 2020, Beneficient’s loan portfolio had exposure to 118 professionally managed alternative investment funds, comprised of 350 underlying investments, and approximately 92 percent of Beneficient’s loan portfolio was collateralized by investments in private companies. Beneficient’s loan portfolio diversification spans across these industry sectors, geographic regions and exposure types:
A graphic accompanying this announcement is available at https://www.globenewswire.com/NewsRoom/AttachmentNg/823dc06d-1eee-4f28-9b3e-6e8146447718
Assets in the collateral portfolio consist primarily of interests in alternative investment vehicles (also referred to as funds) that are managed by a group of U.S. and non-U.S. based alternative asset management firms that invest in a variety of financial markets and utilize a variety of investment strategies. The vintages of the funds in the collateral portfolio as of December 31, 2019 ranged from 1998 to 2011.
5. Additional Information
Gain (Loss) on Life Insurance Policies (in thousands):
| |
Three Months Ended
March 31, |
|
| |
2020 |
|
|
2019 |
|
| Change in estimated probabilistic cash flows(1) |
$ |
17,851 |
|
|
$ |
17,131 |
|
| Unrealized gain on acquisitions(2) |
|
— |
|
|
|
4,459 |
|
| Premiums and other annual fees |
|
(17,199 |
) |
|
|
(15,832 |
) |
| Face value of matured policies |
|
25,502 |
|
|
|
30,459 |
|
| Fair value of matured policies |
|
(11,709 |
) |
|
|
(14,721 |
) |
| Gain (loss) on life insurance policies, net |
$ |
14,445 |
|
|
$ |
21,496 |
|
| |
|
|
|
|
|
|
|
(1) Change in fair value of expected future cash flows relating to the investment in life insurance policies that are not specifically attributable to changes in life expectancy, discount rate changes or policy maturity events.
(2) Gain resulting from fair value in excess of the purchase price for life insurance policies acquired during the reporting period.
Policy Benefits Realized and Premiums Paid (TTM):
| Quarter End Date |
|
Portfolio
Face Amount
(in thousands) |
|
|
12-Month
Trailing
Benefits
Realized
(in thousands) |
|
|
12-Month
Trailing
Premiums
Paid
(in thousands) |
|
|
12-Month
Trailing
Benefits/Premium
Coverage
Ratio |
|
| March 31, 2016 |
|
1,027,821 |
|
|
21,845 |
|
|
28,771 |
|
|
75.9 |
% |
| June 30, 2016 |
|
1,154,798 |
|
|
30,924 |
|
|
31,891 |
|
|
97.0 |
% |
| September 30, 2016 |
|
1,272,078 |
|
|
35,867 |
|
|
37,055 |
|
|
96.8 |
% |
| December 31, 2016 |
|
1,361,675 |
|
|
48,452 |
|
|
40,239 |
|
|
120.4 |
% |
| March 31, 2017 |
|
1,447,558 |
|
|
48,189 |
|
|
42,753 |
|
|
112.7 |
% |
| June 30, 2017 |
|
1,525,363 |
|
|
49,295 |
|
|
45,414 |
|
|
108.5 |
% |
| September 30, 2017 |
|
1,622,627 |
|
|
53,742 |
|
|
46,559 |
|
|
115.4 |
% |
| December 31, 2017 |
|
1,676,148 |
|
|
64,719 |
|
|
52,263 |
|
|
123.8 |
% |
| March 31, 2018 |
|
1,758,066 |
|
|
60,248 |
|
|
53,169 |
|
|
113.3 |
% |
| June 30, 2018 |
|
1,849,079 |
|
|
76,936 |
|
|
53,886 |
|
|
142.8 |
% |
| September 30, 2018 |
|
1,961,598 |
|
|
75,161 |
|
|
55,365 |
|
|
135.8 |
% |
| December 31, 2018 |
|
2,047,992 |
|
|
71,090 |
|
|
52,675 |
|
|
135.0 |
% |
| March 31, 2019 |
|
2,098,428 |
|
|
87,045 |
|
|
56,227 |
|
|
154.8 |
% |
| June 30, 2019 |
|
2,088,445 |
|
|
82,421 |
|
|
59,454 |
|
|
138.6 |
% |
| September 30, 2019 |
|
2,064,156 |
|
|
101,918 |
|
|
61,805 |
|
|
164.9 |
% |
| December 31, 2019 |
|
2,020,973 |
|
|
125,148 |
|
|
63,851 |
|
|
196.0 |
% |
| March 31, 2020 |
|
2,000,680 |
|
|
120,191 |
|
|
65,224 |
|
|
184.3 |
% |
| |
|
|
|
|
|
|
|
|
|
|
|
|
Webcast Details
Management will host a webcast Monday, May 18, 2020 at 4:30 p.m. EDT to discuss financial and operating results. The webcast will give viewers audio and access to PowerPoint slides that illustrate points made during the presentation. To register for the webcast, go to http://get.gwgh.com/q12020webcastinvite.
After the webcast is completed, a replay of it can be accessed at http://get.gwgh.com/q12020webcast.
About GWG Holdings, Inc.
GWG Holdings, Inc. (Nasdaq: GWGH), a financial services holding company committed to transforming the alternative asset industry through innovative liquidity products and related services for the owners of illiquid alternative investments, is the parent company of GWG Life, LLC, which owns a portfolio of $2.0 billion in face value of life insurance policy benefits as of March 31, 2020. GWGH has executed a series of strategic transactions with The Beneficient Company Group, L.P., a financial services company providing proprietary liquidity solutions to owners of alternative assets, resulting in the closer alignment of the two companies.
For more information about GWG Holdings, email info@gwgh.com or visit www.gwgh.com. For more information about Beneficient, email askben@beneficient.com or visit www.trustben.com.
Cautionary Statement Regarding Forward-Looking Statements
This press release contains forward-looking statements that involve substantial risks and uncertainties. All statements, other than statements of historical facts, included in this press release regarding our strategy, future operations, future financial position, future revenue, projected costs, prospects, plans and objectives of management are forward-looking statements. The words "anticipate," "believe," "estimate," "expect," "intend," "may," "plan," "would," "target" and similar expressions are intended to identify forward-looking statements, although not all forward-looking statements contain these identifying words. These forward-looking statements include, among other things, statements about our estimates regarding future revenue and financial performance. We may not actually achieve the expectations disclosed in our forward-looking statements, and you should not place undue reliance on our forward-looking statements. Actual results or events could differ materially from the expectations disclosed in the forward-looking statements that we make. More information about potential factors that could affect our business and financial results is contained in our filings with the Securities and Exchange Commission, including our Quarterly Report on Form 10-Q filed with the Securities and Exchange Commission (“SEC”) on May 15, 2020, and our Annual Report on Form 10-K filed with the SEC on March 27, 2020. Additional information will also be set forth in our future quarterly reports on Form 10-Q, annual reports on Form 10-K and other filings that we make with the SEC. We do not intend, and undertake no duty, to release publicly any updates or revisions to any forward-looking statements contained herein.
Media Contact:
Dan Callahan
Director of Communication
GWG Holdings, Inc.
(612) 787-5744
dcallahan@gwgh.com
GWG HOLDINGS, INC. AND SUBSIDIARIES
CONSOLIDATED BALANCE SHEETS
(dollars in thousands)
| |
March 31,
2020
(unaudited) |
|
December 31,
2019 |
|
| ASSETS |
|
|
|
|
| Cash and cash equivalents |
$ |
116,432 |
|
|
$ |
79,073 |
|
| Restricted cash |
|
26,446 |
|
|
|
20,258 |
|
| Investment in life insurance policies, at fair value |
|
802,181 |
|
|
|
796,039 |
|
| Life insurance policy benefits receivable, net |
|
15,330 |
|
|
|
23,031 |
|
| Loans receivable, net of unearned income |
|
219,296 |
|
|
|
232,344 |
|
| Allowance for loan losses |
|
(700 |
) |
|
|
— |
|
| Loans receivable, net |
|
218,596 |
|
|
|
232,344 |
|
| Fees receivable |
|
30,453 |
|
|
|
29,168 |
|
| Financing receivables from affiliates |
|
68,290 |
|
|
|
67,153 |
|
| Other assets |
|
33,906 |
|
|
|
30,135 |
|
| Goodwill |
|
2,372,595 |
|
|
|
2,358,005 |
|
| TOTAL ASSETS |
$ |
3,684,229 |
|
|
$ |
3,635,206 |
|
| |
|
|
|
|
|
|
| LIABILITIES & STOCKHOLDERS’ EQUITY |
|
|
|
|
|
|
| LIABILITIES |
|
|
|
|
|
|
| Senior credit facility with LNV Corporation |
$ |
188,793 |
|
|
$ |
174,390 |
|
| L Bonds |
|
1,009,781 |
|
|
|
926,638 |
|
| Seller Trust L Bonds |
|
366,892 |
|
|
|
366,892 |
|
| Other borrowings |
|
152,597 |
|
|
|
153,086 |
|
| Interest and dividends payable |
|
22,403 |
|
|
|
16,516 |
|
| Deferred revenue |
|
39,651 |
|
|
|
41,444 |
|
| Accounts payable and accrued expenses |
|
21,139 |
|
|
|
27,836 |
|
| Deferred tax liability, net |
|
40,206 |
|
|
|
57,923 |
|
| TOTAL LIABILITIES |
|
1,841,462 |
|
|
|
1,764,725 |
|
| |
|
|
|
|
|
|
| Redeemable noncontrolling interests |
|
1,241,641 |
|
|
|
1,269,654 |
|
| |
|
|
|
|
|
|
| STOCKHOLDERS’ EQUITY |
|
|
|
|
|
|
| |
|
|
|
|
|
|
| REDEEMABLE PREFERRED STOCK |
|
|
|
|
|
|
| (par value $0.001; shares authorized 100,000; shares outstanding 69,756 and 84,636; liquidation preference of $70,163 and $85,130 as of March 31, 2020 and December 31, 2019, respectively) |
|
59,142 |
|
|
|
74,023 |
|
| SERIES 2 REDEEMABLE PREFERRED STOCK |
|
|
|
|
|
|
| (par value $0.001; shares authorized 150,000; shares outstanding 146,812 and 147,164; liquidation preference of $147,668 and $148,023 as of March 31, 2020 and December 31, 2019, respectively) |
|
127,516 |
|
|
|
127,868 |
|
| COMMON STOCK |
|
|
|
|
|
|
| (par value $0.001; shares authorized 210,000,000; shares issued and outstanding 30,535,249 and 30,533,793 as of March 31, 2020 and December 31, 2019, respectively) |
|
33 |
|
|
|
33 |
|
| Common stock in treasury, at cost (2,500,000 shares as of both March 31, 2020 and December 31, 2019) |
|
(24,550 |
) |
|
|
(24,550 |
) |
| Additional paid-in capital |
|
229,207 |
|
|
|
233,106 |
|
| Accumulated deficit |
|
(121,933 |
) |
|
|
(76,501 |
) |
| TOTAL GWG HOLDINGS STOCKHOLDERS’ EQUITY |
|
269,415 |
|
|
|
333,979 |
|
| Noncontrolling interests |
|
331,711 |
|
|
|
266,848 |
|
| TOTAL STOCKHOLDERS’ EQUITY |
|
601,126 |
|
|
|
600,827 |
|
| TOTAL LIABILITIES & STOCKHOLDERS’ EQUITY |
$ |
3,684,229 |
|
|
$ |
3,635,206 |
|
| |
|
|
|
|
|
|
|
GWG HOLDINGS, INC. AND SUBSIDIARIES
CONSOLIDATED STATEMENTS OF OPERATIONS
(dollars in thousands)
(unaudited)
| |
Three Months Ended
March 31, |
|
| |
2020 |
|
|
2019 |
|
| REVENUE |
|
|
|
|
|
| Gain on life insurance policies, net |
$ |
14,445 |
|
|
$ |
21,496 |
|
| Interest and other income |
|
19,112 |
|
|
|
3,721 |
|
| TOTAL REVENUE |
|
33,557 |
|
|
|
25,217 |
|
| |
|
|
|
|
|
|
|
| EXPENSES |
|
|
|
|
|
|
|
| Interest expense |
|
35,871 |
|
|
|
26,975 |
|
| Employee compensation and benefits |
|
77,704 |
|
|
|
5,154 |
|
| Legal and professional fees |
|
6,163 |
|
|
|
2,947 |
|
| Provision for loan losses |
|
700 |
|
|
|
— |
|
| Other expenses |
|
3,612 |
|
|
|
2,828 |
|
| TOTAL EXPENSES |
|
124,050 |
|
|
|
37,904 |
|
| |
|
|
|
|
|
|
|
| LOSS BEFORE INCOME TAXES |
|
(90,493 |
) |
|
|
(12,687 |
) |
| INCOME TAX BENEFIT |
|
(14,507 |
) |
|
|
— |
|
| |
|
|
|
|
|
|
|
| NET LOSS BEFORE LOSS FROM EQUITY METHOD INVESTMENT |
|
(75,986 |
) |
|
|
(12,687 |
) |
| |
|
|
|
|
|
|
|
| Loss from equity method investment |
|
(1,530 |
) |
|
|
(1,927 |
) |
| |
|
|
|
|
|
|
|
| NET LOSS |
|
(77,516 |
) |
|
|
(14,614 |
) |
| |
|
|
|
|
|
|
|
| Net loss attributable to noncontrolling interests |
|
32,084 |
|
|
|
— |
|
| |
|
|
|
|
|
|
|
| Less: Preferred stock dividends |
|
3,952 |
|
|
|
4,296 |
|
| NET LOSS ATTRIBUTABLE TO COMMON SHAREHOLDERS |
$ |
(49,384 |
) |
|
$ |
(18,910 |
) |
| NET LOSS PER COMMON SHARE |
|
|
|
|
|
|
|
| Basic |
$ |
(1.62 |
) |
|
$ |
(0.57 |
) |
| Diluted |
$ |
(1.62 |
) |
|
$ |
(0.57 |
) |
| |
|
|
|
|
|
|
|
| WEIGHTED AVERAGE COMMON SHARES OUTSTANDING |
|
|
|
|
|
|
|
| Basic |
|
30,534,977 |
|
|
|
32,984,741 |
|
| Diluted |
|
30,534,977 |
|
|
|
32,984,741 |
|
| |
|
|
|
|
|
|
|

Source: GWG Holdings, Inc.
|