|
DALLAS, Aug. 17, 2020 (GLOBE NEWSWIRE) -- Today, GWG Holdings, Inc. (Nasdaq: GWGH), an innovative financial services firm based in Dallas, announced its financial and operating results for the second quarter ended June 30, 2020. The results reflect consolidated accounting and financial reporting of GWGH and The Beneficient Company Group, L.P. and its consolidated subsidiaries (collectively, Beneficient). GWGH and Beneficient are referred to collectively as the Company.
Recent Corporate Developments
- Despite the uncertainty surrounding the novel coronavirus pandemic (COVID-19), and although a substantial majority of our employees continue to work remotely, we have maintained our operations at or near normal levels. The Company continues to raise capital, receive interest income and insurance policy benefits, pay interest income and dividends and otherwise meet its ongoing obligations.
• A survey of advisors conducted by GWGH in June found high satisfaction in its communication about the Company’s products and services during these uncertain times.
- GWGH closed its publicly registered $1 billion L Bond offering in July 2020 and began raising capital under a new $2 billion L Bond offering.
- Effective June 29, 2020, the Company was again included in the Russell 2000® Index of small-cap U.S. stocks, an important bellwether for the U.S. economy.
- The Company hired key sales executives Michele Drummond as Vice President of National Accounts in the western half of the U.S. and Ben Hilgers as Regional Vice President for Florida and Puerto Rico.
- Beneficient launched a liquidity platform for an untapped market of mid-to-high-net-worth individuals, small-to-midsized institutional investors and family offices that own alternative assets. Beneficient’s product will enable these investors to access simple, rapid and cost-effective liquidity solutions.
• Beneficient’s trust charter applications are pending approval by the Texas Department of Banking. Beneficient has closed a limited number of transactions to date but intends to significantly expand its operations if and when the trust charters are issued.
- On July 6, 2020, GWGH filed documents with the SEC seeking authority to have the option to effect an exchange of its equity securities for securities issued by GWGH or one or more of its subsidiaries. The Company believes this proposed change is a potential avenue to create additional organizational efficiencies for the Company while at the same time enabling it to grow the consolidated balance sheet in a prudent and sustainable manner, and in turn create additional potential value for its shareholders.
- Effective July 15, 2020, GWGH entered into a Preferred Series C Unit Purchase Agreement with Beneficient that will allow GWGH to make additional capital contributions to Beneficient as Beneficient continues to expand its operations.
- On July 29, 2020, GWGH, represented by its Special Committee, approved a transaction by which GWGH agreed to convert its promissory note with certain LiquidTrust borrowers and any related accrued interest, into a $75.0 million capital account of Preferred C interests in BCH. The outstanding balance of the promissory note on June 30, 2020, with accrued and unpaid interest thereon, was $69.4 million.
- On August 13, 2020, GWG DLP Funding V, LLC (DLP V), a wholly owned subsidiary of GWG Life, LLC, and Beneficient Capital Company, LLC (BCC), a wholly owned subsidiary of Beneficient, together with BCC’s senior lender entered into a credit agreement amending and restating the terms and conditions regarding Beneficient’s current credit agreement, which had approximately $124.5 million in senior debt outstanding. The Second Amended and Restated Credit Agreement provides for, among other things, DLP V’s assumption of the senior debt following the occurrences of certain conditions, including Beneficient’s receipt of the trust charters currently pending before the Texas Department of Banking.
Second Quarter 2020 Financial and Operating Highlights
- Reported second quarter 2020 net loss of $18.1 million, compared to a net loss of $25.6 million in the second quarter of 2019:
• GWGH’s investment in Beneficient was accounted for as an equity method investment prior to the change-of-control on December 31, 2019, and the second quarter of 2020 includes the consolidated results of Beneficient.
- Reported total assets of $3.7 billion as of both June 30, 2020, and March 31, 2020.
- Reported continued strong life insurance portfolio performance:
• Realized $39.9 million of face amount of policy benefits from 29 life insurance policies during the second quarter of 2020, compared to $23.0 million from 19 life insurance policies during the second quarter of 2019.
• Ended the quarter with a life insurance portfolio of $2.0 billion in face amount of policy benefits consisting of 1,102 policies.
- Reported continued success raising capital through the L Bond investment product with $93.5 million of L Bond sales in the second quarter of 2020.
- Total liquidity (cash, restricted cash, policy benefits receivable and fees receivable) increased to $219.7 million on June 30, 2020, compared to $188.7 million on March 31, 2020.
“This past quarter marked a significant milestone as Beneficient launched a first-of-its-kind liquidity platform to serve the large, growing and untapped market of mid-to-high-net-worth individuals, small-to-midsized institutional investors and family offices seeking simple, rapid and cost-effective liquidity solutions for their alternatives assets,” said Murray Holland, GWGH’s Chief Executive Officer. “The fact that our investment sales have been consistently strong during this period, while so many have operated under stay-at-home orders and other restrictions, demonstrates the confidence we have earned from a very active network of advisors and places us in a robust position for the future.”
1. Financial & Operating Highlights
| ($ Thousands except per share information) |
|
Q2 2020 |
|
Q2 2019 |
|
YTD 2020 |
|
YTD 2019 |
| Revenue |
|
$ |
68,789 |
|
|
|
$ |
24,010 |
|
|
|
$ |
102,346 |
|
|
|
$ |
49,227 |
|
|
| Expenses |
|
68,720 |
|
|
|
45,941 |
|
|
|
192,770 |
|
|
|
83,845 |
|
|
| Income Tax Benefit |
|
(8,550 |
) |
|
|
— |
|
|
|
(23,057 |
) |
|
|
— |
|
|
| Income (Loss) from Equity Method Investments |
|
(1,318 |
) |
|
|
600 |
|
|
|
(2,848 |
) |
|
|
(1,327 |
) |
|
| Net Income (Loss), including Income (Loss) from Equity Method Investment |
|
7,301 |
|
|
|
(21,331 |
) |
|
|
(70,215 |
) |
|
|
(35,945 |
) |
|
| Loss (Income) Attributable to Noncontrolling Interests |
|
(21,723 |
) |
|
|
— |
|
|
|
10,361 |
|
|
|
— |
|
|
| Preferred Stock Dividends |
|
3,714 |
|
|
|
4,278 |
|
|
|
7,666 |
|
|
|
8,574 |
|
|
| Net Loss Attributable to Common Shareholders |
|
(18,136 |
) |
|
|
(25,609 |
) |
|
|
(67,520 |
) |
|
|
(44,519 |
) |
|
| Per Share Data: |
|
|
|
|
|
|
|
|
| Net Loss1 |
|
(0.59 |
) |
|
|
(0.78 |
) |
|
|
(2.21 |
) |
|
|
(1.35 |
) |
|
| Capital Raised from L Bonds |
|
93,519 |
|
|
|
45,241 |
|
|
|
202,572 |
|
|
|
171,227 |
|
|
| Liquidity2 |
|
219,692 |
|
|
|
82,461 |
|
|
|
219,692 |
|
|
|
82,461 |
|
|
| Life Insurance Portfolio3 |
|
1,960,826 |
|
|
|
2,088,445 |
|
|
|
1,960,826 |
|
|
|
2,088,445 |
|
|
| Life Insurance Acquired3 |
|
— |
|
|
|
12,955 |
|
|
|
— |
|
|
|
93,166 |
|
|
| Face Value of Matured Policies |
|
39,889 |
|
|
|
22,998 |
|
|
|
65,391 |
|
|
|
53,457 |
|
|
| TTM Benefits / Premiums4 |
|
205.1 |
% |
|
|
138.6 |
% |
|
|
205.1 |
% |
|
|
138.6 |
% |
|
1. Per diluted common share outstanding
2. Includes cash, restricted cash, policy benefits receivable and fees receivable as of the end of the period presented
3. Face amount of policy benefits as of the end of the period presented.
4. The ratio of policy benefits realized to premiums paid on a trailing twelve month (TTM) basis.
2. Revenue and Expense Discussion
Second Quarter 2020 vs. Second Quarter 2019:
- Total revenue was $68.8 million in the current period, compared to $24.0 million in the prior period primarily due to:
• $36.3 million of other income recognized by Beneficient in the second quarter of 2020 as a result of the forfeiture of vested equity-based compensation related to one former director of Beneficient.
• $11.3 million of interest income added as a result of the consolidation of Beneficient.
• $4.8 million of trust services revenues added as a result of the consolidation of Beneficient.
• The aforementioned increases were partially offset by $5.1 million lower net gain on life insurance policies due to no gain on policy acquisitions, higher premiums paid and maturities of policies with a higher cumulative cost basis
- Total expenses were $68.7 million in the current period, compared to $45.9 million in the prior period primarily due to:
• $8.7 million higher interest expense due to higher average outstanding balances of L Bonds, senior credit facility and Beneficient debt.
• Higher employee compensation and benefits ($5.0 million), legal and professional fees ($2.9 million) and other expenses ($6.2 million) primarily due to the consolidation of Beneficient. Other expenses include Beneficient’s provision for loan losses of $7.2 million for the second quarter 2020.
Six Months Ended June 30, 2020 vs. Six Months Ended June 30, 2019:
- Total revenue was $102.3 million in the current period, compared to $49.2 million in the prior period primarily due to:
• $36.3 million of other income recognized by Beneficient in the second quarter of 2020 as a result of the forfeiture of vested equity-based compensation related to one former director of Beneficient.
• $23.5 million of interest income added as a result of the consolidation of Beneficient.
• $9.9 million of trust services revenues added as a result of the consolidation of Beneficient.
• The aforementioned increases were partially offset by $12.2 million lower net gain on life insurance policies due to no gain on policy acquisitions, higher premiums paid and maturities of policies with a higher cumulative cost basis.
- Total expenses were $192.8 million in the current period, compared to $83.8 million in the prior period primarily due to:
• Employee compensation and benefits increased by $77.6 million primarily due to the inclusion of Beneficient's operations, including the recognition of $73.3 million of non-cash, equity-based compensation expense under Beneficient's equity incentive plans.
• $17.6 million higher interest expense due to higher average outstanding balances of L Bonds, senior credit facility and Beneficient debt.
• Higher legal and professional fees ($6.1 million) and other expenses ($7.6 million) primarily due to the consolidation of Beneficient. Other expenses include Beneficient’s provision for loan losses of $7.9 million for the six months ended June 30, 2020.
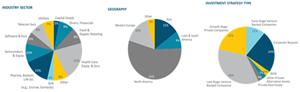
3. Beneficient’s Collateral Portfolio Information
As of June 30, 2020, Beneficient’s loan portfolio had exposure to 120 professionally managed alternative investment funds, comprised of 368 underlying investments, and approximately 87 percent of Beneficient’s loan portfolio was collateralized by investments in private companies. Beneficient’s loan portfolio diversification spans across these industry sectors, geographic regions and exposure types:
A graphic accompanying this announcement is available at https://www.globenewswire.com/NewsRoom/AttachmentNg/996c9c8d-7574-4345-b370-ec3e48b3e2a4
Assets in the collateral portfolio consist primarily of interests in alternative investment vehicles (also referred to as funds) that are managed by a group of U.S. and non-U.S. based alternative asset management firms that invest in a variety of financial markets and utilize a variety of investment strategies. The vintages of the funds in the collateral portfolio as of June 30, 2020 ranged from 1998 to 2016.
4. Life Insurance Portfolio Statistics as of and for the quarter ended June 30, 2020
Portfolio Summary:
| Total life insurance portfolio face value of policy benefits (in thousands) |
$ |
1,960,826 |
|
| Average face value per policy (in thousands) |
$ |
1,779 |
|
| Average face value per insured life (in thousands) |
$ |
1,915 |
|
| Weighted average age of insured (years) |
|
82.7 |
|
| Weighted average life expectancy estimate (years) |
|
6.9 |
|
| Total number of policies |
|
1,102 |
|
| Number of unique lives |
|
1,024 |
|
| Demographics |
|
74% male; 26% female |
|
| Number of smokers |
|
45 |
|
| Largest policy as % of total portfolio face value |
|
0.7 |
% |
| Average policy as % of total portfolio |
|
0.1 |
% |
| Average annual premium as % of face value |
|
3.6 |
% |
Distribution of Policies and Benefits by Current Age of Insured
| |
|
|
|
|
|
|
|
|
Percentage of Total |
|
Weighted |
|
Min
Age |
|
Max
Age |
|
Number
of Policies |
|
Policy
Benefits |
|
|
Number of
Policies |
|
Policy
Benefits |
|
Average
LE
(Years) |
|
| 95 |
|
101 |
|
24 |
|
$ |
45,602 |
|
|
|
|
2.2 |
% |
|
|
2.3 |
% |
|
2.1 |
|
| 90 |
|
94 |
|
144 |
|
|
286,510 |
|
|
|
|
13.0 |
% |
|
|
14.6 |
% |
|
3.1 |
|
| 85 |
|
89 |
|
237 |
|
|
550,928 |
|
|
|
|
21.5 |
% |
|
|
28.1 |
% |
|
4.9 |
|
| 80 |
|
84 |
|
229 |
|
|
408,437 |
|
|
|
|
20.8 |
% |
|
|
20.8 |
% |
|
7.3 |
|
| 75 |
|
79 |
|
218 |
|
|
380,759 |
|
|
|
|
19.8 |
% |
|
|
19.4 |
% |
|
9.8 |
|
| 70 |
|
74 |
|
197 |
|
|
229,052 |
|
|
|
|
17.9 |
% |
|
|
11.7 |
% |
|
10.8 |
|
| 60 |
|
69 |
|
53 |
|
|
59,538 |
|
|
|
|
4.8 |
% |
|
|
3.1 |
% |
|
11.2 |
|
| Total |
|
|
|
1,102 |
|
$ |
1,960,826 |
|
|
|
|
100.0 |
% |
|
|
100.0 |
% |
|
6.9 |
|
| |
|
|
|
|
|
|
|
|
|
|
|
|
|
|
|
|
|
|
|
|
5. Additional Information
Gain (Loss) on Life Insurance Policies (in thousands):
| |
|
Three Months Ended
June 30, |
|
Six Months Ended
June 30, |
| |
|
2020 |
|
2019 |
|
2020 |
|
2019 |
| Change in estimated probabilistic cash flows(1) |
|
$ |
15,349 |
|
|
|
$ |
17,122 |
|
|
|
$ |
33,200 |
|
|
|
$ |
34,253 |
|
|
| Unrealized gain on acquisitions(2) |
|
— |
|
|
|
1,844 |
|
|
|
— |
|
|
|
6,303 |
|
|
| Premiums and other annual fees |
|
(17,626 |
) |
|
|
(16,004 |
) |
|
|
(34,825 |
) |
|
|
(31,836 |
) |
|
| Face value of matured policies |
|
39,889 |
|
|
|
22,998 |
|
|
|
65,391 |
|
|
|
53,457 |
|
|
| Fair value of matured policies |
|
(22,824 |
) |
|
|
(6,030 |
) |
|
|
(34,533 |
) |
|
|
(20,751 |
) |
|
| Gain on life insurance policies, net |
|
$ |
14,788 |
|
|
|
$ |
19,930 |
|
|
|
$ |
29,233 |
|
|
|
$ |
41,426 |
|
|
| |
|
|
|
|
|
|
|
|
|
|
|
|
|
|
|
|
|
|
|
|
___________________________________
(1) Change in fair value of expected future cash flows relating to the investment in life insurance policies that are not specifically attributable to changes in life expectancy, discount rate changes or policy maturity events.
(2) Gain resulting from fair value in excess of the purchase price for life insurance policies acquired during the reporting period. There were no policy acquisitions during the three or six months ended June 30, 2020.
Policy Benefits Realized and Premiums Paid (TTM):
| Quarter End Date |
Portfolio Face
Amount
(in thousands) |
12-Month
Trailing
Benefits
Realized
(in thousands) |
12-Month
Trailing
Premiums
Paid
(in thousands) |
12-Month
Trailing
Benefits/Premium
Coverage
Ratio |
| June 30, 2016 |
|
1,154,798 |
|
|
30,924 |
|
|
31,891 |
|
|
97.0 |
% |
| September 30, 2016 |
|
1,272,078 |
|
|
35,867 |
|
|
37,055 |
|
|
96.8 |
% |
| December 31, 2016 |
|
1,361,675 |
|
|
48,452 |
|
|
40,239 |
|
|
120.4 |
% |
| March 31, 2017 |
|
1,447,558 |
|
|
48,189 |
|
|
42,753 |
|
|
112.7 |
% |
| June 30, 2017 |
|
1,525,363 |
|
|
49,295 |
|
|
45,414 |
|
|
108.5 |
% |
| September 30, 2017 |
|
1,622,627 |
|
|
53,742 |
|
|
46,559 |
|
|
115.4 |
% |
| December 31, 2017 |
|
1,676,148 |
|
|
64,719 |
|
|
52,263 |
|
|
123.8 |
% |
| March 31, 2018 |
|
1,758,066 |
|
|
60,248 |
|
|
53,169 |
|
|
113.3 |
% |
| June 30, 2018 |
|
1,849,079 |
|
|
76,936 |
|
|
53,886 |
|
|
142.8 |
% |
| September 30, 2018 |
|
1,961,598 |
|
|
75,161 |
|
|
55,365 |
|
|
135.8 |
% |
| December 31, 2018 |
|
2,047,992 |
|
|
71,090 |
|
|
52,675 |
|
|
135.0 |
% |
| March 31, 2019 |
|
2,098,428 |
|
|
87,045 |
|
|
56,227 |
|
|
154.8 |
% |
| June 30, 2019 |
|
2,088,445 |
|
|
82,421 |
|
|
59,454 |
|
|
138.6 |
% |
| September 30, 2019 |
|
2,064,156 |
|
|
101,918 |
|
|
61,805 |
|
|
164.9 |
% |
| December 31, 2019 |
|
2,020,973 |
|
|
125,148 |
|
|
63,851 |
|
|
196.0 |
% |
| March 31, 2020 |
|
2,000,680 |
|
|
120,191 |
|
|
65,224 |
|
|
184.3 |
% |
| June 30, 2020 |
|
1,960,826 |
|
|
137,082 |
|
|
66,846 |
|
|
205.1 |
% |
Webcast Details
Management will host a webcast Monday, August 17, 2020 at 4:30 p.m. EDT to discuss financial and operating results. The webcast will give viewers audio and access to PowerPoint slides that illustrate points made during the presentation. To register for the webcast, go to http://get.gwgh.com/q22020webcastinvite.
After the webcast is completed, a replay can be accessed at http://get.gwgh.com/q22020webcast.
About GWG Holdings, Inc.
GWG Holdings, Inc. (Nasdaq: GWGH) is an innovative financial services firm based in Dallas, Texas that is a leader in providing investments that are non-correlated to the traded markets, and unique liquidity solutions and services for the owners of illiquid investments. Through its subsidiaries, The Beneficient Company Group, L.P. and GWG Life, LLC, GWGH owns and manages a diverse portfolio of alternative assets that, as of June 30, 2020, included $2.0 billion in life insurance policy benefits, and exposure to a diversified and growing loan portfolio secured by 120 professionally managed alternative investment funds.
For more information about GWG Holdings, email info@gwgh.com or visit www.gwgh.com. For more information about Beneficient, email askben@beneficient.com or visit www.trustben.com.
Cautionary Statement Regarding Forward-Looking Statements
This press release contains forward-looking statements that involve substantial risks and uncertainties. All statements, other than statements of historical facts, included in this press release regarding our strategy, future operations, future financial position, future revenue, projected costs, prospects, plans and objectives of management are forward-looking statements. The words “anticipate,” “believe,” “estimate,” “expect,” “intend,” “may,” “plan,” “would,” “target” and similar expressions are intended to identify forward-looking statements, although not all forward-looking statements contain these identifying words. These forward-looking statements include, among other things, statements about our estimates regarding future revenue and financial performance. We may not actually achieve the expectations disclosed in our forward-looking statements, and you should not place undue reliance on our forward-looking statements. Actual results or events could differ materially from the expectations disclosed in the forward-looking statements that we make. More information about potential factors that could affect our business and financial results is contained in our filings with the Securities and Exchange Commission, including our Quarterly Report on Form 10-Q filed with the Securities and Exchange Commission (“SEC”) on August 14, 2020, and our Annual Report on Form 10-K filed with the SEC on March 27, 2020. Additional information will also be set forth in our future quarterly reports on Form 10-Q, annual reports on Form 10-K and other filings that we make with the SEC. We do not intend, and undertake no duty, to release publicly any updates or revisions to any forward-looking statements contained herein.
Media Contact:
Dan Callahan
Director of Communication
GWG Holdings, Inc.
(612) 787-5744
dcallahan@gwgh.com
GWG HOLDINGS, INC. AND SUBSIDIARIES
CONDENSED CONSOLIDATED BALANCE SHEETS
(dollars in thousands)
| |
June 30,
2020 (unaudited) |
|
December 31,
2019 |
| ASSETS |
|
|
|
| Cash and cash equivalents |
$ |
149,233 |
|
|
|
$ |
79,073 |
|
|
| Restricted cash |
19,059 |
|
|
|
20,258 |
|
|
| Investment in life insurance policies, at fair value |
794,706 |
|
|
|
796,039 |
|
|
| Life insurance policy benefits receivable, net |
19,789 |
|
|
|
23,031 |
|
|
| Loans receivable, net of unearned income |
218,448 |
|
|
|
232,344 |
|
|
| Allowance for loan losses |
(7,900 |
) |
|
|
— |
|
|
| Loans receivable, net |
210,548 |
|
|
|
232,344 |
|
|
| Fees receivable |
31,611 |
|
|
|
29,168 |
|
|
| Financing receivables from affiliates |
69,428 |
|
|
|
67,153 |
|
|
| Other assets |
40,142 |
|
|
|
30,135 |
|
|
| Goodwill |
2,384,121 |
|
|
|
2,358,005 |
|
|
| TOTAL ASSETS |
$ |
3,718,637 |
|
|
|
$ |
3,635,206 |
|
|
| LIABILITIES & STOCKHOLDERS’ EQUITY |
|
|
|
| LIABILITIES |
|
|
|
| Senior credit facility with LNV Corporation |
$ |
203,578 |
|
|
|
$ |
174,390 |
|
|
| L Bonds |
1,072,973 |
|
|
|
926,638 |
|
|
| Seller Trust L Bonds |
366,892 |
|
|
|
366,892 |
|
|
| Other borrowings |
152,118 |
|
|
|
153,086 |
|
|
| Interest and dividends payable |
23,284 |
|
|
|
16,516 |
|
|
| Deferred revenue |
37,858 |
|
|
|
41,444 |
|
|
| Accounts payable and accrued expenses |
23,457 |
|
|
|
27,836 |
|
|
| Deferred tax liability, net |
33,674 |
|
|
|
57,923 |
|
|
| TOTAL LIABILITIES |
1,913,834 |
|
|
|
1,764,725 |
|
|
| |
|
|
|
| Redeemable noncontrolling interests |
1,264,031 |
|
|
|
1,269,654 |
|
|
| |
|
|
|
| STOCKHOLDERS’ EQUITY |
|
|
|
| |
|
|
|
| REDEEMABLE PREFERRED STOCK |
|
|
|
| (par value $0.001; shares authorized 100,000; shares outstanding 62,986 and 84,636; liquidation preference of $63,354 and $85,130 as of June 30, 2020 and December 31, 2019, respectively) |
52,373 |
|
|
|
74,023 |
|
|
| SERIES 2 REDEEMABLE PREFERRED STOCK |
|
|
|
| (par value $0.001; shares authorized 150,000; shares outstanding 144,325 and 147,164; liquidation preference of $145,167 and $148,023 as of June 30, 2020 and December 31, 2019, respectively) |
125,029 |
|
|
|
127,868 |
|
|
| COMMON STOCK |
|
|
|
| (par value $0.001; shares authorized 210,000,000; shares issued and outstanding 30,537,481 and 30,533,793 as of June 30, 2020 and December 31, 2019, respectively) |
33 |
|
|
|
33 |
|
|
| Common stock in treasury, at cost (2,500,000 shares as of both June 30, 2020 and December 31, 2019) |
(24,550 |
) |
|
|
(24,550 |
) |
|
| Additional paid-in capital |
225,537 |
|
|
|
233,106 |
|
|
| Accumulated deficit |
(136,355 |
) |
|
|
(76,501 |
) |
|
| TOTAL GWG HOLDINGS STOCKHOLDERS’ EQUITY |
242,067 |
|
|
|
333,979 |
|
|
| Noncontrolling interests |
298,705 |
|
|
|
266,848 |
|
|
| TOTAL STOCKHOLDERS’ EQUITY |
540,772 |
|
|
|
600,827 |
|
|
| TOTAL LIABILITIES & STOCKHOLDERS’ EQUITY |
$ |
3,718,637 |
|
|
|
$ |
3,635,206 |
|
|
| |
|
|
|
|
|
|
|
|
|
GWG HOLDINGS, INC. AND SUBSIDIARIES
CONSOLIDATED STATEMENTS OF OPERATIONS
(dollars in thousands)
(unaudited)
| |
Three Months Ended
June 30, |
|
Six Months Ended
June 30, |
| |
2020 |
|
2019 |
|
2020 |
|
2019 |
| REVENUE |
|
|
|
|
|
|
|
| Gain on life insurance policies, net |
$ |
14,788 |
|
|
|
$ |
19,930 |
|
|
|
$ |
29,233 |
|
|
|
$ |
41,426 |
|
|
| Interest income |
12,671 |
|
|
|
3,881 |
|
|
|
26,660 |
|
|
|
7,337 |
|
|
| Trust services revenues |
4,829 |
|
|
|
— |
|
|
|
9,856 |
|
|
|
— |
|
|
| Other income |
36,501 |
|
|
|
199 |
|
|
|
36,597 |
|
|
|
464 |
|
|
| TOTAL REVENUE |
68,789 |
|
|
|
24,010 |
|
|
|
102,346 |
|
|
|
49,227 |
|
|
| EXPENSES |
|
|
|
|
|
|
|
| Interest expense |
37,142 |
|
|
|
28,487 |
|
|
|
73,013 |
|
|
|
55,462 |
|
|
| Employee compensation and benefits |
11,840 |
|
|
|
6,794 |
|
|
|
89,544 |
|
|
|
11,948 |
|
|
| Legal and professional fees |
7,643 |
|
|
|
4,722 |
|
|
|
13,806 |
|
|
|
7,669 |
|
|
| Provision for loan losses |
7,200 |
|
|
|
— |
|
|
|
7,900 |
|
|
|
— |
|
|
| Other expenses |
4,895 |
|
|
|
5,938 |
|
|
|
8,507 |
|
|
|
8,766 |
|
|
| TOTAL EXPENSES |
68,720 |
|
|
|
45,941 |
|
|
|
192,770 |
|
|
|
83,845 |
|
|
| INCOME (LOSS) BEFORE INCOME TAXES |
69 |
|
|
|
(21,931 |
) |
|
|
(90,424 |
) |
|
|
(34,618 |
) |
|
| INCOME TAX BENEFIT |
(8,550 |
) |
|
|
— |
|
|
|
(23,057 |
) |
|
|
— |
|
|
| NET INCOME (LOSS) BEFORE LOSS FROM EQUITY METHOD INVESTMENT |
8,619 |
|
|
|
(21,931 |
) |
|
|
(67,367 |
) |
|
|
(34,618 |
) |
|
| Income (loss) from equity method investment |
(1,318 |
) |
|
|
600 |
|
|
|
(2,848 |
) |
|
|
(1,327 |
) |
|
| NET INCOME (LOSS) |
7,301 |
|
|
|
(21,331 |
) |
|
|
(70,215 |
) |
|
|
(35,945 |
) |
|
| Net loss (income) attributable to noncontrolling interests |
(21,723 |
) |
|
|
— |
|
|
|
10,361 |
|
|
|
— |
|
|
| Less: Preferred stock dividends |
3,714 |
|
|
|
4,278 |
|
|
|
7,666 |
|
|
|
8,574 |
|
|
| NET LOSS ATTRIBUTABLE TO COMMON SHAREHOLDERS |
$ |
(18,136 |
) |
|
|
$ |
(25,609 |
) |
|
|
$ |
(67,520 |
) |
|
|
$ |
(44,519 |
) |
|
| NET LOSS PER COMMON SHARE |
|
|
|
|
|
|
|
| Basic |
$ |
(0.59 |
) |
|
|
$ |
(0.78 |
) |
|
|
$ |
(2.21 |
) |
|
|
$ |
(1.35 |
) |
|
| Diluted |
$ |
(0.59 |
) |
|
|
$ |
(0.78 |
) |
|
|
$ |
(2.21 |
) |
|
|
$ |
(1.35 |
) |
|
| WEIGHTED AVERAGE COMMON SHARES OUTSTANDING |
|
|
|
|
|
|
|
| Basic |
30,536,830 |
|
|
|
33,011,603 |
|
|
|
30,535,811 |
|
|
|
32,998,246 |
|
|
| Diluted |
30,536,830 |
|
|
|
33,011,603 |
|
|
|
30,535,811 |
|
|
|
32,998,246 |
|
|

Source: GWG Holdings, Inc.
|