|
DALLAS, Nov. 23, 2020 (GLOBE NEWSWIRE) -- Today, GWG Holdings, Inc. (Nasdaq: GWGH), an innovative financial services firm based in Dallas, announced its financial and operating results for the third quarter ended September 30, 2020. The results reflect consolidated accounting and financial reporting of GWGH and The Beneficient Company Group, L.P. and its consolidated subsidiaries (collectively, Beneficient). GWGH and Beneficient are referred to collectively as the Companies.
Over the last quarter, the Companies and their Boards of Directors have continued to focus on achieving a common goal of increasing enterprise value by diversifying and maximizing revenue streams while seeking to mitigate risk.
Beneficient Liquidity Program
- Beneficient launched a suite of liquidity solutions, including the Liquidity Bond, for owners of professionally managed illiquid alternative investments who need liquidity from their investments. Central to the launch was the ability to structure the program in a manner that permits the Companies to publicly advertise and promote their products; thereby, allowing the Companies to reach a broad market.
- To assist Beneficient in offering its products in a simple, rapid, and cost-effective manner, Beneficient built AltAccess, a proprietary online secure portal that connects Beneficient to its target market without a brick and mortar presence, expensive legacy information technology needs, or bank branch technology operations costs.
- Since launching its liquidity solutions, Beneficient has sourced approximately $300 million of alternative investments from registered investment advisers, family offices, general partners, foundations, and other types of investors through its AltAccess portal. Of these amounts, approximately $100 million of alternative investments are currently being priced or are under active consideration and approximately $200 million are waiting on responses from potential counterparties.
- Beneficient closed financings of approximately $8.1 million of principal balance in October 2020.
Beneficient Operational Developments
- Beneficient’s Risk Management and Underwriting teams play a critical role in identifying, evaluating, and managing Beneficient’s collateral portfolio, including through their creation of unique systems.
- TotalAlt was developed by Beneficient’s Risk Management team as a comprehensive portfolio management system designed to build and maintain a risk-optimized collateral portfolio by employing and synchronizing accepted principles of diversified portfolio construction, alternative asset valuation, and hedging strategies to manage the quality, makeup and risk profile of Beneficient’s collateral portfolio.
- AltRating is an original grading system built by Beneficient’s Underwriting and Risk Management teams to analytically review new and existing loans and is tailored specifically to evaluate loans collateralized with alternative assets. The system evaluates various loan metrics using internally generated simulation models to create a rating score reflecting the probabilistic risk of default for each loan.
Organizational Developments
- The Companies hired Grant Thornton LLP as the independent registered public auditing firm for the Companies.
- The Companies have taken the following steps to assist management in its oversight of the Companies’ financial reporting and controls in the collateral portfolio supporting Beneficient’s financings:
- engaged an internationally recognized accounting firm to prepare a quarterly valuation opinion on the collateral that supports Beneficient’s loan portfolio;
- engaged an internationally recognized accounting firm to consult with GWGH and Beneficient’s internal audit department;
- engaged a nationally recognized accounting firm to review and assist with reporting on the cost basis and loan balances of Beneficient’s financings of alternative assets;
- purchased a multi-year hedge with a bulge bracket investment bank to protect Beneficient’s loan portfolio against potential market corrections and reduce the loan portfolio’s equity market risk exposure; and
- continued automation of middle and back office functions, which will allow the Companies to scale the business, and minimize cost with more accuracy.
Capital Raising Efforts
- After successfully closing its $1 billion L Bond investment offering, GWGH began selling a $2 billion L Bond offering in summer of 2020 to a growing network of advisors from 127 firms.
- L Bonds sales for the three months ended September 30, 2020, totaled $114.1 million, including $42.9 million in September 2020.
- L Bond sales for the nine months ended September 30, 2020, were 14% higher than 2019 sales over the same period.
- On October 13, 2020, Robert A. Stanger & Co., Inc. ranked GWG as #8 of the top alternative investment sponsors in terms of capital formation.
- Despite the uncertainty surrounding the novel coronavirus pandemic (COVID-19), and although a substantial majority of the Companies’ employees continue to work remotely, they have maintained operations at or near normal levels. The Companies have not experienced any significant disruptions due to operational issues, loss of communication capabilities, technological failures, or cyberattacks. The Companies continue to raise capital, receive interest income and insurance policy benefits, pay interest income and dividends, and otherwise meet their ongoing obligations.
Life insurance and Loan Portfolio performance
- Mortality performance in the life insurance portfolio continues to perform consistently with the Actual-to-Expected analysis:
- Third quarter 2020 – $39.8 million actual vs. $35.1 million expected
- Year to date 2020 – $105.2 million actual vs. $100.8 million expected
- Beneficient’s loans continue to generate both interest and administrative fee income consistent with their contractual rates – $11.6 million and $4.6 million, respectively, for the three months ended September 30, 2020
- The loan-to-value ratio for Beneficient’s collateral portfolio was 63% as of September 30, 2020, based on $227.0 million loan carrying value and collateral value of $361.7 million.
Third Quarter 2020 Financial and Operating Highlights
- Reported third quarter 2020 net loss of $68.1 million, compared to $24.6 million in the third quarter of 2019, primarily related to increased interest expense ($12.5 million), non-cash deferred income tax expense ($22.4 million), and non-cash equity incentive compensation ($22.9 million).
- Reported total assets of $3.6 billion as of September 30, 2020, and $3.7 billion as of June 30, 2020.
- Reported continued strong life insurance portfolio performance:
- Realized $39.8 million of face amount of policy benefits from 21 life insurance policies during the third quarter of 2020, compared to $27.5 million from 22 life insurance policies during the third quarter of 2019.
- Ended the quarter with a life insurance portfolio of $1.9 billion in face amount of policy benefits consisting of 1,081 policies.
- Reported continued success raising capital through the L Bond investment product with $114.1 million of L Bond sales in the third quarter of 2020.
- Reported $22.4M of non-cash deferred income tax expense primarily related to management’s reassessment of GWGH’s deferred tax liabilities. GWGH reported a material weakness in internal controls over the quarterly income tax provision process, as reported in GWGH’s Quarterly Report on Form 10-Q filed with the SEC on November 19, 2020. Management is reevaluating the internal and external resources involved in the quarterly assessment and believes these measures will enable it to quickly remediate the material weakness.
- Total liquidity (cash, restricted cash, policy benefits receivable and fees receivable) decreased to $177.7 million at September 30, 2020, compared to $219.7 million at June 30, 2020. This reduction is largely reflective of the paydowns of senior credit facilities at Beneficient on July 15 and September 10, 2020, totaling $50 million.
“The market is responding very well to the unique offerings we have created to deliver liquidity products and yield to investors across the U.S.,” said Murray Holland, GWGH's Chief Executive Officer. “The roll-out of the Beneficient products has gone as expected and our L Bond sales remain strong. We believe we are poised for a break-out success at a time when there has never been a greater need for the products and services we have created.”
1. Financial & Operating Highlights
| ($ Thousands except per share information) |
|
Q3 2020 |
|
Q3 2019 |
|
YTD 2020 |
|
YTD 2019 |
| Revenue |
|
$ |
28,513 |
|
|
$ |
22,211 |
|
|
$ |
130,859 |
|
|
$ |
71,439 |
|
| Expenses |
|
81,963 |
|
|
43,570 |
|
|
274,733 |
|
|
127,416 |
|
| Income Tax Expense (Benefit) |
|
22,444 |
|
|
— |
|
|
(613 |
) |
|
— |
|
| Income (Loss) from Equity Method Investments |
|
(1,431 |
) |
|
956 |
|
|
(4,279 |
) |
|
(371 |
) |
| Net Loss, including Income (Loss) from Equity Method Investment |
|
(77,325 |
) |
|
(20,403 |
) |
|
(147,540 |
) |
|
(56,348 |
) |
| Loss Attributable to Noncontrolling Interests |
|
12,745 |
|
|
— |
|
|
23,106 |
|
|
— |
|
| Preferred Stock Dividends |
|
3,569 |
|
|
4,232 |
|
|
11,235 |
|
|
12,806 |
|
| Net Loss Attributable to Common Shareholders |
|
(68,149 |
) |
|
(24,635 |
) |
|
(135,669 |
) |
|
(69,154 |
) |
| Per Share Data: |
|
|
|
|
|
|
|
|
| Net Loss1 |
|
(2.23 |
) |
|
(0.75 |
) |
|
(4.44 |
) |
|
(2.09 |
) |
| Capital Raised from L Bonds |
|
114,061 |
|
|
107,012 |
|
|
317,302 |
|
|
278,239 |
|
| Liquidity2 |
|
177,745 |
|
|
91,254 |
|
|
177,745 |
|
|
91,254 |
|
| Life Insurance Portfolio3 |
|
1,921,067 |
|
|
2,064,156 |
|
|
1,921,067 |
|
|
2,064,156 |
|
| Life Insurance Acquired3 |
|
— |
|
|
3,155 |
|
|
— |
|
|
96,321 |
|
| Face Value of Matured Policies |
|
39,803 |
|
|
27,470 |
|
|
105,194 |
|
|
80,927 |
|
| TTM Benefits / Premiums4 |
|
220.0 |
% |
|
164.9 |
% |
|
220.0 |
% |
|
164.9 |
% |
1. Per diluted common share outstanding.
2. Includes cash, restricted cash, policy benefits receivable and fees receivable as of the end of the period presented.
3. Face amount of policy benefits as of the end of the period presented.
4. The ratio of policy benefits realized to premiums paid on a trailing twelve-month (TTM) basis.
2. Revenue and Expense Discussion
Third Quarter 2020 vs. Third Quarter 2019:
- Total revenue was $28.5 million in the current period, compared to $22.2 million in the prior period primarily due to:
- $11.6 million of interest income and $4.6 million of trust services revenues at Beneficient.
- The aforementioned increases were partially offset by:
- $3.7 million lower net gain on life insurance policies due to no gain on policy acquisitions, higher premiums paid, and maturities of policies with a higher cumulative cost basis.
- $3.2 million decrease to the fair value of Beneficient’s investment in put options entered into on July 17, 2020, as its multi-year hedge to protect its loan portfolio against potential market corrections.
- Total expenses were $82.0 million in the current period, compared to $43.6 million in the prior period primarily due to:
- $12.5 million higher interest expense due to higher average outstanding balances of L Bonds and the senior credit facility, as well as the consolidation of the Beneficient debt beginning December 31, 2019, which was paid down by $50 million in July and September 2020.
- Higher employee compensation and benefits ($24.6 million), legal and professional fees ($5.2 million) and other expenses ($1.0 million) primarily due to the consolidation of Beneficient. The increased employee compensation and benefits expense is primarily related to non-cash, equity-based compensation expense under Beneficient’s equity incentive plans. These expenses are partially offset by Beneficient’s loan loss provision recapture of $5.0 million during the third quarter 2020.
Nine Months Ended September 30, 2020 vs. Nine Months Ended September 30, 2019:
- Total revenue was $130.9 million in the current period, compared to $71.4 million in the prior period primarily due to:
- $36.3 million of other income recognized by Beneficient in the second quarter of 2020 as a result of the forfeiture of vested equity-based compensation related to one former director of Beneficient.
- $35.1 million of interest income and $14.4 million of trust services revenues added as a result of the consolidation of Beneficient.
- The aforementioned increases were partially offset by:
- $15.9 million lower net gain on life insurance policies due to no gain on policy acquisitions, higher premiums paid and maturities of policies with a higher cumulative cost basis.
- $3.2 million decrease to the fair value of Beneficient’s investment in put options entered into on July 17, 2020.
- Total expenses were $274.7 million in the current period, compared to $127.4 million in the prior period primarily due to:
- Employee compensation and benefits increased by $102.2 million primarily due to the inclusion of Beneficient’s operations, including the recognition of $96.3 million of non-cash, equity-based compensation expense under Beneficient’s equity incentive plans, which includes amounts awarded to Beneficient’s founders, directors, and certain employees, some receiving 100% vesting at the time of grant due to the terms of their grants or the length of their service.
- $30.1 million higher interest expense due to higher average outstanding balances of L Bonds, senior credit facility and Beneficient debt.
- Higher legal and professional fees ($11.4 million), provision for loan losses ($2.9 million), and other expenses ($0.7 million) primarily due to the consolidation of Beneficient effective as of December 31, 2019.
3. Beneficient’s Collateral Portfolio Information
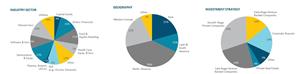
As of September 30, 2020, Beneficient’s loan portfolio had exposure to 122 professionally managed alternative investment funds, comprising 323 underlying investments. Beneficient’s loan portfolio diversification to alternative assets spans across the following industry sectors, geographic regions and exposure types based on the underlying Net Asset Value (NAV):
A graphic accompanying this announcement is available at https://www.globenewswire.com/NewsRoom/AttachmentNg/a65248aa-a3e4-481e-a69e-909e994cb971
Assets in the collateral portfolio include interests in alternative investment vehicles (also referred to as funds) that are managed by a group of U.S. and non-U.S. based alternative asset management firms that invest in a variety of financial markets and utilize a variety of investment strategies. The vintages of the funds in the collateral portfolio as of September 30, 2020 ranged from 1993 to 2016.
4. Life Insurance Portfolio Statistics as of and for the quarter ended September 30, 2020
Portfolio Summary:
| Total life insurance portfolio face value of policy benefits (in thousands) |
$ |
1,921,067 |
|
| Average face value per policy (in thousands) |
$ |
1,777 |
|
| Average face value per insured life (in thousands) |
$ |
1,913 |
|
| Weighted average age of insured (years) |
|
82.9 |
|
| Weighted average life expectancy estimate (years) |
|
6.9 |
|
| Total number of policies |
|
1,081 |
|
| Number of unique lives |
|
1,004 |
|
| Demographics |
|
74% male; 26% female |
|
| Number of smokers |
|
43 |
|
| Largest policy as % of total portfolio face value |
|
0.7 |
% |
| Average policy as % of total portfolio |
|
0.1 |
% |
| Average annual premium as % of face value |
|
3.7 |
% |
| |
|
|
|
Distribution of Policies and Benefits by Current Age of Insured:
| |
|
|
|
|
|
|
|
Percentage of Total |
|
Weighted |
| Min Age |
|
Max Age |
|
Number of
Policies |
|
Policy
Benefits |
|
Number of
Policies |
|
Policy
Benefits |
|
Average LE
(Years) |
| 63 |
|
69 |
|
45 |
|
$ |
50,840 |
|
|
4.2 |
% |
|
2.6 |
% |
|
10.3 |
| 70 |
|
74 |
|
199 |
|
230,244 |
|
|
18.4 |
% |
|
12.0 |
% |
|
10.7 |
| 75 |
|
79 |
|
207 |
|
364,936 |
|
|
19.1 |
% |
|
19.0 |
% |
|
9.6 |
| 80 |
|
84 |
|
221 |
|
392,196 |
|
|
20.5 |
% |
|
20.5 |
% |
|
7.4 |
| 85 |
|
89 |
|
235 |
|
547,893 |
|
|
21.7 |
% |
|
28.5 |
% |
|
4.9 |
| 90 |
|
94 |
|
149 |
|
284,856 |
|
|
13.8 |
% |
|
14.8 |
% |
|
3.1 |
| 95 |
|
100 |
|
25 |
|
50,102 |
|
|
2.3 |
% |
|
2.6 |
% |
|
2.2 |
| Total |
|
|
|
1,081 |
|
$ |
1,921,067 |
|
|
100.0 |
% |
|
100.0 |
% |
|
6.9 |
| |
|
|
|
|
|
|
|
|
|
|
|
|
|
|
|
|
5. Additional Information
Gain (Loss) on Life Insurance Policies (in thousands):
| |
|
Three Months Ended
September 30, |
|
Nine Months Ended
September 30, |
| |
|
2020 |
|
2019 |
|
2020 |
|
2019 |
| Change in estimated probabilistic cash flows(1) |
|
$ |
14,723 |
|
|
$ |
17,908 |
|
|
$ |
47,923 |
|
|
$ |
52,161 |
|
| Unrealized gain on acquisitions(2) |
|
— |
|
|
472 |
|
|
— |
|
|
6,775 |
|
| Premiums and other annual fees |
|
(18,235 |
) |
|
(17,219 |
) |
|
(53,060 |
) |
|
(49,055 |
) |
| Face value of matured policies |
|
39,803 |
|
|
27,470 |
|
|
105,194 |
|
|
80,927 |
|
| Fair value of matured policies |
|
(22,169 |
) |
|
(10,839 |
) |
|
(56,702 |
) |
|
(31,590 |
) |
| Gain on life insurance policies, net |
|
$ |
14,122 |
|
|
$ |
17,792 |
|
|
$ |
43,355 |
|
|
$ |
59,218 |
|
___________________________________
(1) Change in fair value of expected future cash flows relating to the investment in life insurance policies that are not specifically attributable to changes in life expectancy, discount rate changes or policy maturity events.
(2) Gain resulting from fair value in excess of the purchase price for life insurance policies acquired during the reporting period. There were no policy acquisitions during the nine months ended September 30, 2020.
| |
| |
| Policy Benefits Realized and Premiums Paid (TTM): |
| Quarter End Date |
Portfolio Face
Amount (in
thousands) |
12-Month
Trailing
Benefits
Realized
(in thousands) |
12-Month
Trailing
Premiums
Paid
(in thousands) |
12-Month
Trailing
Benefits/Premium
Coverage
Ratio |
| September 30, 2016 |
|
1,272,078 |
|
|
35,867 |
|
|
37,055 |
|
|
96.8 |
% |
| December 31, 2016 |
|
1,361,675 |
|
|
48,452 |
|
|
40,239 |
|
|
120.4 |
% |
| March 31, 2017 |
|
1,447,558 |
|
|
48,189 |
|
|
42,753 |
|
|
112.7 |
% |
| June 30, 2017 |
|
1,525,363 |
|
|
49,295 |
|
|
45,414 |
|
|
108.5 |
% |
| September 30, 2017 |
|
1,622,627 |
|
|
53,742 |
|
|
46,559 |
|
|
115.4 |
% |
| December 31, 2017 |
|
1,676,148 |
|
|
64,719 |
|
|
52,263 |
|
|
123.8 |
% |
| March 31, 2018 |
|
1,758,066 |
|
|
60,248 |
|
|
53,169 |
|
|
113.3 |
% |
| June 30, 2018 |
|
1,849,079 |
|
|
76,936 |
|
|
53,886 |
|
|
142.8 |
% |
| September 30, 2018 |
|
1,961,598 |
|
|
75,161 |
|
|
55,365 |
|
|
135.8 |
% |
| December 31, 2018 |
|
2,047,992 |
|
|
71,090 |
|
|
52,675 |
|
|
135.0 |
% |
| March 31, 2019 |
|
2,098,428 |
|
|
87,045 |
|
|
56,227 |
|
|
154.8 |
% |
| June 30, 2019 |
|
2,088,445 |
|
|
82,421 |
|
|
59,454 |
|
|
138.6 |
% |
| September 30, 2019 |
|
2,064,156 |
|
|
101,918 |
|
|
61,805 |
|
|
164.9 |
% |
| December 31, 2019 |
|
2,020,973 |
|
|
125,148 |
|
|
63,851 |
|
|
196.0 |
% |
| March 31, 2020 |
|
2,000,680 |
|
|
120,191 |
|
|
65,224 |
|
|
184.3 |
% |
| June 30, 2020 |
|
1,960,826 |
|
|
137,082 |
|
|
66,846 |
|
|
205.1 |
% |
| September 30, 2020 |
|
1,921,067 |
|
|
149,415 |
|
|
67,931 |
|
|
220.0 |
% |
| |
|
|
|
|
|
|
|
|
|
|
|
|
Webcast Details
Management will host a webcast today, Monday, November 23, 2020 at 4:30 p.m. EST to discuss financial and operating results. The webcast will give viewers audio and access to PowerPoint slides that illustrate points made during the presentation. To register for the webcast, go to http://get.gwgh.com/q32020webcastinvite.
After the webcast is completed, a replay of it can be accessed at http://get.gwgh.com/q32020webcast.
About GWG Holdings, Inc.
GWG Holdings, Inc. (Nasdaq: GWGH) is an innovative financial services firm based in Dallas, Texas that is a leader in providing investments that are non-correlated to the traded markets, and unique liquidity solutions and services for the owners of illiquid investments. Through its subsidiaries, The Beneficient Company Group, L.P. and GWG Life, LLC, GWGH owns and manages a diverse portfolio of alternative assets that, as of September 30, 2020, included $1.9 billion in life insurance policy benefits, and exposure to a diversified and growing loan portfolio secured by 122 professionally managed alternative investment funds.
For more information about GWG Holdings, email info@gwgh.com or visit www.gwgh.com. For more information about Beneficient, email askben@beneficient.com or visit www.trustben.com.
Cautionary Statement Regarding Forward-Looking Statements and Other Disclaimers:
This press release contains forward-looking statements that involve substantial risks and uncertainties. All statements, other than statements of historical facts, included in this press release regarding our strategy, future operations, future financial position, future revenue, projected costs, prospects, plans and objectives of management are forward-looking statements. The words “anticipate,” “believe,” “estimate,” “expect,” “intend,” “may,” “plan,” “would,” “target” and similar expressions are intended to identify forward-looking statements, although not all forward-looking statements contain these identifying words. These forward-looking statements include, among other things, statements about our estimates regarding future revenue and financial performance. We may not actually achieve the expectations disclosed in our forward-looking statements, and you should not place undue reliance on our forward-looking statements. Actual results or events could differ materially from the expectations disclosed in the forward-looking statements that we make. More information about potential factors that could affect our business and financial results is contained in our filings with the Securities and Exchange Commission, including our Quarterly Report on Form 10-Q filed with the Securities and Exchange Commission (“SEC”) on November 19, 2020, and our Annual Report on Form 10-K filed with the SEC on March 27, 2020. Additional information will also be set forth in our future quarterly reports on Form 10-Q, annual reports on Form 10-K and other filings that we make with the SEC. We do not intend, and undertake no duty, to release publicly any updates or revisions to any forward-looking statements contained herein.
These materials contain data concerning interests in alternative assets. The cash flow from these interests underlie the senior beneficial interests and beneficial interests in trusts that comprise the collateral of Ben’s loan portfolio. The data presented herein does not contain information relating to non-alternative assets (such as common stock and bonds of GWGH) and is derived from, among other things, third-party information regarding the net asset value (NAV) of these alternative assets and investments within these alternative assets. Generally, Beneficient uses the most recently received NAV report from each investment manager, which can be adjusted for certain cash and non-cash items including capital calls, distributions, updated material events, and currency valuation adjustments. Beneficient is not affiliated with, and has no control over, any portfolio investment manager, including with respect to the timing, accuracy and completeness of their reporting of financial and other data. Additional information regarding Beneficient's loan portfolio is available on its website at www.trustben.com. The information on Beneficient's website is not part of, or incorporated by reference in, this press release.
Media Contact:
Dan Callahan
Director of Communication
GWG Holdings, Inc.
(612) 787-5744
dcallahan@gwgh.com
| |
| |
GWG HOLDINGS, INC. AND SUBSIDIARIES
CONDENSED CONSOLIDATED BALANCE SHEETS
(dollars in thousands) |
| |
| |
September 30,
2020 (unaudited) |
|
December 31,
2019 |
| ASSETS |
|
|
|
| Cash and cash equivalents |
$ |
93,766 |
|
|
$ |
79,073 |
|
| Restricted cash |
15,990 |
|
|
20,258 |
|
| Investment in life insurance policies, at fair value |
787,260 |
|
|
796,039 |
|
| Life insurance policy benefits receivable, net |
36,418 |
|
|
23,031 |
|
| Loans receivable, net of discount |
229,961 |
|
|
232,344 |
|
| Allowance for loan losses |
(2,914 |
) |
|
— |
|
| Loans receivable, net |
227,047 |
|
|
232,344 |
|
| Fees receivable |
31,571 |
|
|
29,168 |
|
| Financing receivables from affiliates |
— |
|
|
67,153 |
|
| Other assets |
53,501 |
|
|
30,135 |
|
| Goodwill |
2,384,121 |
|
|
2,358,005 |
|
| TOTAL ASSETS |
$ |
3,629,674 |
|
|
$ |
3,635,206 |
|
| LIABILITIES & STOCKHOLDERS’ EQUITY |
|
|
|
| LIABILITIES |
|
|
|
| Senior credit facility with LNV Corporation |
$ |
203,907 |
|
|
$ |
174,390 |
|
| L Bonds |
1,154,519 |
|
|
926,638 |
|
| Seller Trust L Bonds |
366,892 |
|
|
366,892 |
|
| Other borrowings |
100,178 |
|
|
153,086 |
|
| Interest and dividends payable |
23,821 |
|
|
16,516 |
|
| Deferred revenue |
35,848 |
|
|
41,444 |
|
| Accounts payable and accrued expenses |
33,235 |
|
|
27,836 |
|
| Deferred tax liability, net |
52,500 |
|
|
57,923 |
|
| TOTAL LIABILITIES |
1,970,900 |
|
|
1,764,725 |
|
| |
|
|
|
| Redeemable noncontrolling interests |
1,246,753 |
|
|
1,269,654 |
|
| |
|
|
|
| STOCKHOLDERS’ EQUITY |
|
|
|
| |
|
|
|
| REDEEMABLE PREFERRED STOCK |
|
|
|
(par value $0.001; shares authorized 100,000; shares outstanding 59,681 and 84,636;
liquidation preference of $63,354 and $85,130 as of September 30, 2020 and
December 31, 2019, respectively) |
49,068 |
|
|
74,023 |
|
| SERIES 2 REDEEMABLE PREFERRED STOCK |
|
|
|
(par value $0.001; shares authorized 150,000; shares outstanding 137,341 and
147,164; liquidation preference of $138,142 and $148,023 as of September 30, 2020
and December 31, 2019, respectively) |
118,045 |
|
|
127,868 |
|
| COMMON STOCK |
|
|
|
(par value $0.001; shares authorized 210,000,000; shares issued and outstanding
33,094,664 and 33,033,793 as of September 30, 2020 and December 31, 2019,
respectively) |
33 |
|
|
33 |
|
Common stock in treasury, at cost (2,500,000 shares as of both September 30, 2020
and December 31, 2019) |
(24,550 |
) |
|
(24,550 |
) |
| Additional paid-in capital |
178,969 |
|
|
233,106 |
|
| Accumulated deficit |
(200,935 |
) |
|
(76,501 |
) |
| TOTAL GWG HOLDINGS STOCKHOLDERS’ EQUITY |
167,406 |
|
|
333,979 |
|
| Noncontrolling interests |
291,391 |
|
|
266,848 |
|
| TOTAL STOCKHOLDERS’ EQUITY |
412,021 |
|
|
600,827 |
|
| TOTAL LIABILITIES & STOCKHOLDERS’ EQUITY |
$ |
3,629,674 |
|
|
$ |
3,635,206 |
|
| |
|
|
|
|
|
|
|
GWG HOLDINGS, INC. AND SUBSIDIARIES
CONSOLIDATED STATEMENTS OF OPERATIONS
(dollars in thousands)
(unaudited) |
| |
| |
|
Three Months Ended
September 30, |
|
Nine Months Ended
September 30, |
| |
|
2020 |
|
2019 |
|
2020 |
|
2019 |
| REVENUE |
|
|
|
|
|
|
|
|
| Gain on life insurance policies, net |
|
$ |
14,122 |
|
|
$ |
17,792 |
|
|
$ |
43,355 |
|
|
$ |
59,219 |
|
| Interest income |
|
12,928 |
|
|
3,935 |
|
|
39,588 |
|
|
11,273 |
|
| Trust services revenues |
|
4,556 |
|
|
— |
|
|
14,412 |
|
|
— |
|
| Other income (loss) |
|
(3,093 |
) |
|
484 |
|
|
33,504 |
|
|
947 |
|
| TOTAL REVENUE |
|
28,513 |
|
|
22,211 |
|
|
130,859 |
|
|
71,439 |
|
| EXPENSES |
|
|
|
|
|
|
|
|
| Interest expense |
|
40,792 |
|
|
28,290 |
|
|
113,805 |
|
|
83,752 |
|
| Employee compensation and benefits |
|
33,777 |
|
|
9,137 |
|
|
123,321 |
|
|
21,085 |
|
| Legal and professional fees |
|
7,830 |
|
|
2,594 |
|
|
21,636 |
|
|
10,263 |
|
| (Recapture) provision for loan losses |
|
(4,986 |
) |
|
— |
|
|
2,914 |
|
|
— |
|
| Other expenses |
|
4,550 |
|
|
3,549 |
|
|
13,057 |
|
|
12,316 |
|
| TOTAL EXPENSES |
|
81,963 |
|
|
43,570 |
|
|
274,733 |
|
|
127,416 |
|
| LOSS BEFORE INCOME TAXES |
|
(53,450 |
) |
|
(21,359 |
) |
|
(143,874 |
) |
|
(55,977 |
) |
| INCOME TAX EXPENSE (BENEFIT) |
|
22,444 |
|
|
— |
|
|
(613 |
) |
|
— |
|
| NET LOSS BEFORE INCOME (LOSS) FROM EQUITY METHOD INVESTMENT |
|
(75,894 |
) |
|
(21,359 |
) |
|
(143,261 |
) |
|
(55,977 |
) |
| Income (loss) from equity method investment |
|
(1,431 |
) |
|
956 |
|
|
(4,279 |
) |
|
(371 |
) |
| NET LOSS |
|
(77,325 |
) |
|
(20,403 |
) |
|
(147,540 |
) |
|
(56,348 |
) |
| Net loss attributable to noncontrolling interests |
|
12,745 |
|
|
— |
|
|
23,106 |
|
|
— |
|
| Less: Preferred stock dividends |
|
3,569 |
|
|
4,232 |
|
|
11,235 |
|
|
12,806 |
|
| NET LOSS ATTRIBUTABLE TO COMMON SHAREHOLDERS |
|
$ |
(68,149 |
) |
|
$ |
(24,635 |
) |
|
$ |
(135,669 |
) |
|
$ |
(69,154 |
) |
| NET LOSS PER COMMON SHARE |
|
|
|
|
|
|
|
|
| Basic |
|
$ |
(2.23 |
) |
|
$ |
(0.75 |
) |
|
$ |
(4.44 |
) |
|
$ |
(2.09 |
) |
| Diluted |
|
$ |
(2.23 |
) |
|
$ |
(0.75 |
) |
|
$ |
(4.44 |
) |
|
$ |
(2.09 |
) |
| WEIGHTED AVERAGE COMMON SHARES OUTSTANDING |
|
|
|
|
|
|
|
|
| Basic |
|
30,584,719 |
|
|
33,033,420 |
|
|
30,552,233 |
|
|
33,010,100 |
|
| Diluted |
|
30,584,719 |
|
|
33,033,420 |
|
|
30,552,233 |
|
|
33,010,100 |
|

Source: GWG Holdings, Inc.
|